Capturing WebRTC traffic looks relatively easy, and most of the times it really is: you just need to launch tools like tcpdump or Wireshark on the machine of one of the peers (or on any machine that is in the media path), and then have a look at the file that has been generated, which most of the times will be a .pcap or .pcapng file. This kind of activity is especially useful when trying to debug connectivity issues or other WebRTC-related problems: in fact, applications like Wireshark automatically recognize standard protocols like STUN and DTLS, that is the procotols WebRTC PeerConnections are founded upon, and with the right nudge (i.e., if you tell them a specific stream contains them) other protocols like RTP and RTCP too. To the right eye, this is very precious information.
What’s the point of this post, then?
Well, the only problem with capturing WebRTC traffic as it is, is that the media content will be encrypted. This is not an issue when having a look at STUN connectivity checks or a DTLS handshake, but it might be when you want to inspect an RTP or RTCP packet, which will be encrypted as SRTP and SRTCP. In fact, while SRTP headers are unencrypted, and so can be inspected no matter how you capture the traffic, the SRTP payloads are not, which means you can’t inspect its contents.
Most of the times you won’t really need to have a look at the content. As anticipated, encrypted RTP packets still have a header you can look at, and that’s where the most commonly needed information is (SSRC, sequence number, timestamp, payload type, etc.). Anyway, the same cannot be said for RTCP: in fact, a single RTCP message may actually contain more than one (compound packets), and there really isn’t a shared header that makes much sense when encrypted. Besides, there may times when having a look at what the RTP payload contains actually makes sense.
Which means, capturing encrypted traffic is nice, but being able to capture the unencrypted traffic as well for debugging purposes might be even nicer. Unfortunately, this is not possible without some help: in fact, browsers always send encrypted traffic when doing WebRTC, and even though some allow you to capture unencrypted traffic for testing purposes, you’ll often need to rely on some other component that has access to the media as well to do the job.
Enter Janus!
As a WebRTC media server, Janus can indeed be that component: in fact, it is definitely on the media path for all the PeerConnection is is involved in. Besides, since it creates separate secure contexts for each of the PeerConnections, even when logically linked from an application perspective, it has access to the unencrypted RTP and RTCP packets, both incoming and outgoing.
This is what we thought about an year ago as well, when, inspired by the Firefox efforts, we first added support for text2pcap dumps, which we worked on in a dedicated branch that was since merged. The approach we followed at the time was quite straightforward:
- using the Admin API, you can start capturing traffic for a specific Janus handle to a file;
- all incoming (after the decryption) and outgoing (before the encryption) RTP/RTCP packets for that handle are serialized to a text format, and saved to the related file;
- after the capture ends, the text2pcap application can be used to convert the captured file to a format compatible with Wireshark or other tools.
The syntax for the request is simple:
POST /admin/sessionId/handleId
{
        "janus" : "start_text2pcap",
        "folder" : "<folder to save the dump to; optional, current folder if missing>",
        "filename" : "<filename of the dump; optional, random filename if missing>",
        "truncate" : "<number of bytes to truncate at; optional, won't truncate if 0 or missing>",
        "transaction" : "<random alphanumeric string>",
        "admin_secret" : "<password specified in janus.cfg, if any>"
}
which makes it easy to craft a curl one-liner to start capturing the traffic for a handle, if the related session and handle identifiers are known:
curl -X POST -H "Content-Type: application/json" -d '{"janus": "start_text2pcap", "folder": "/tmp", "filename": "my-test2pcap-dump.txt", "transaction": "123", "admin_secret": "janusoverlord"}' http://localhost:7088/admin/8412133783240844/2377476017639045
Stopping a capture is even easier, as you just need a stop_text2pcap request to do the job.
Eventually, you’ll end up with a text file that will look like this:
I 18:47:14.126004 000000  80 e0 6c 5d [..] JANUS_TEXT2PCAP_RTP [session=3740061776621518][handle=3149681776118503]
O 18:47:14.128251 000000  80 e0 04 83 [..] JANUS_TEXT2PCAP_RTP [session=3740061776621518][handle=3149681776118503]
I 18:47:14.136577 000000  80 6f 54 8d [..] JANUS_TEXT2PCAP_RTP [session=3740061776621518][handle=3149681776118503]
O 18:47:14.136659 000000  80 6f 03 9f [..] JANUS_TEXT2PCAP_RTP [session=3740061776621518][handle=3149681776118503]
As it is, there isn’t much you can do with this file: we see that there are some incoming (I) and outgoing (P) packets, that were saved at a certain time, we can see the payload as hex values, and at the end of each line there’s some contextual information that is specific to Janus. As anticipated, you’ll need to feed it to another tool, called text2pcap, to convert it to a file that you can study:
text2pcap -D -n -l 1 -i 17 -u 1000,2000 -t '%H:%M:%S.' /tmp/my-test2pcap-dump.txt /tmp/my-test2pcap-dump.pcapng
You can refer to the tool documentation for a detailed explanation of all the options and what they can do for you, but suffice it to say that the above one-liner will basically traverse the text file we captured and convert each packet to a pcapng format, using different IPs and ports for the two parties in the communication, in order to easily distinguish and study incoming and outgoing packets.
But isn’t text serialization inefficient..?
I’m glad you asked! (well, I know you didn’t, and technically I did for storytelling purposes, but just indulge me)
That’s true: while the above mentioned approach was very simple to implement, and works nicely for what it needs to do, it is indeed quite CPU intensive, and way more than it really should. This means that, while it’s a nice tool to have in your belt, you’ll rarely resort to it in a production environment, knowing it might affect the performance of your machine.
This is what eventually led us to work on an alternative approach, that is, saving to a native pcap file directly within Janus, rather than serializing to a text file and postprocess it later. This is exactly what we did in yet another branch we literally just merged. The approach we followed closely mimicked the existing text capture, but with a few subtle differences:
- as before, you use the Admin API to start capturing traffic for a specific Janus handle to a file, but using a different request;
- the pcap global header is saved before capturing anything;
- all incoming (after the decryption) and outgoing (before the encryption) RTP/RTCP packets for that handle are saved to file, but after some “fake” Ethernet/IP/UDP headers are created first, and all prefixed by the pcap packet header.
You may have noticed that no post-processing is involved here: since we’re saving to a pcap file directly, this means that, as soon as we stop capturing, the file can be consumed and studied right away using the appropriate tools. Besides, since no text serialization occurs but we’re writing directly to file, the process is incredibly more lightweight, up to the point that its impact is actually neglectible, and pretty much in line with the media recording feature in Janus.
While the request you use to save to .pcap is different, and named start_pcap instead of start_text2pcap, its syntax is exactly the same as the other one: this means that you’ll be able to provide, exactly as before, information on the file to save to (folder, filename), and whether to truncate or not. Looking at the example made before, then, this is how the request would look like instead:
curl -X POST -H "Content-Type: application/json" -d '{"janus": "start_pcap", "folder": "/tmp", "filename": "my-pcap-dump.pcap", "transaction": "123", "admin_secret": "janusoverlord"}' http://localhost:7088/admin/8412133783240844/2377476017639045
Notice how the only properties we changed were, as anticipated, the request name, and the extension of the target file. Nothing else!
All this curl and JSON is scary! (a.k.a., I’m too lazy to use curl!)
So far we’ve explained what Janus provides in terms of capturing unencrypted traffic, and how you can take advantage of this feature using Admin API requests. Anyway, you may not want to do things by hand or via the command line. Luckily for you, I’m such a nice guy that I prepared a visual interface to that as well!
The Janus repo comes with a few ready-to-use web demos, which includes an Admin API interface. This interface has been introduced in more detail in a previous post, more specifically for the purpose of debugging issues using the information it provides. We won’t repeat the same details, here, but we’ll just focus on how you can start (and stop) a capture for a specific handle within Janus. Of course, we’ll assume that you previously enabled the Admin API backend in the HTTP plugin configuration.
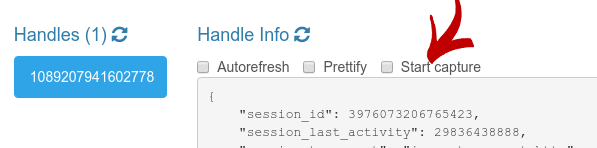
If you have a recent enough version of the Janus demos, and open the Admin API, try navigating the existing session to select a specific handle. You should see a checkbox called “Start capture” before the actual handle information:
Hitting that will make a new dialog appear:

Most of the settings should be quite self-explanatory, as we went through them when introducing the Admin API request syntax in the first place. The first allows you to choose which kind of capture to make, which as we discussed will be a choice between saving to a pcap directly, or serializing to a text file instead:

You’ll then be asked to insert information about where to save the file:

Should you only be interested in the first bytes of a packet, and not all of them (which is the default), it might make sense to truncate the packets before saving them. You can do that using the truncate option:

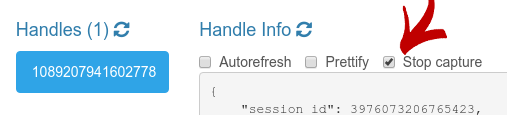
Once a capture has been started, the web page will change the related checkbox, turning it into a control you can use to stop the ongoing capture whenever you want instead:
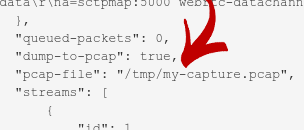
The current capture status will also be available as part of the handle information:
Once the capture is complete, whether a translation via text2pcap is needed or not eventually you’ll end up with a file you can use with a tool like Wireshark. Assuming Wireshark is used, the capture will look pretty much like this:

As anticipated, we can see two different IPs (10.1.1.1 and 10.2.2.2) talking to each other on different ports (1000 and 2000). When Janus captures the traffic, 10.1.1.1:1000 will always be the address of the peer (e.g., the browser), while 10.2.2.2:2000 will always be the address of Janus itself.
Of course, by itself Wireshark won’t be able to figure out that the contents of those UDP packets are actually RTP and RTCP messages. This is something we’ll need to tell it ourselves, decoding the traffic as RTP (which will automatically recognize RTCP packets as well):
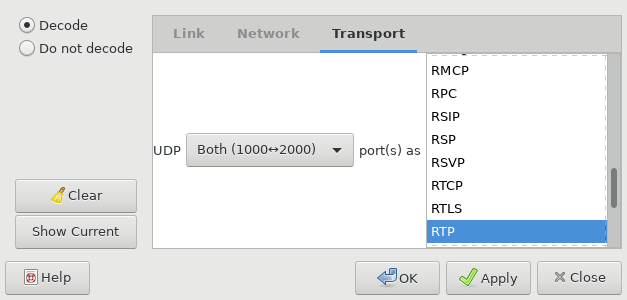
After that, the information presented by Wireshark will be different:

As you can see, Wireshark managed to interpret the RTP header, which can be inspected and analyzed as we wish. The same can be said for the payload as well, which will be unencrypted and open to our greedy eyes.
One less known feature of Wireshark, though, is that it has support for the decapsulation of some media codecs as well. This means that, if you tell Wireshark that a packet contains media encoded with a specific codec, it might give you codec specific information as well. VP8 and H.264 are among those codecs, so if in the settings we statically associate the payload type 96 (video in this captured session) to VP8, the displayed information will change once more:

While this new screenshot looks very similar to the previous one, it actually has a few key differences: notice how the “Protocol” column, for instance, has changed from RTP to VP8 for all packets with payload type 96, now. This means that Wireshark is using a more drill-down dissector for the packets, and can inspect the payload as well: in the cae of VP8, it means accessing the VP8 payload descriptor that prefixes the actual media content, and other fun stuff! Of course, all of this is out of scope to this post, whose only purpose was to demonstrate how you can get access to such information: in case you wish to learn more about debugging this kind of content, you can refer to this excellent blog post written by Philipp Hancke some time ago.
That’s all, folks!
I hope you found this information useful. Looking forward to your thoughts!