WebRTC is an amazing technology, when it works. With just a few lines of JavaScript code, you get audio and video streams with ease in your web page, and with the help of our open source Janus WebRTC gateway you can play with those media to do pretty much what you like. That said, WebRTC can also be incredibly frustrating to novices when it DOESN’T work, that is, whenever you think you did everything right and instead nothing works: you can see others, but others cannot see you, or all you see is a black screen where you expected a Janus stream you configured.
Browsers provide excellent tools for investigating what’s going wrong with a WebRTC PeerConnection: Chrome has the chrome://webrtc-internals page, for example, while Firefox exposes this information in about:webrtc. These pages, though, let you check what’s happening in your browser, but don’t provide much details (unless you know how/where to look) on what’s going on the other side. For this reason, Janus provides the so called Admin API, which presents similar information but with a focus on the internals of Janus itself.
The admin API is not enabled by default, but enabling it is quite easy. At the time of writing, you can do so by editing the related section in janus.cfg, which only provides admin API support via HTTP. The new, upcoming modular transports version allows you to leverage the admin API on other protocols as well: if you’re using that branch, just enable the admin API in the related transport configuration section. For the sake of simplicity, let’s assume you just enabled the admin API with its defaults: this mean the admin API will be available via HTTP on port 7088, at the /admin path and using janusoverlord as the secret to use. Once done that, you can either use our own admin.html page to interact with the admin API, or interact with the API yourself by sending properly constructed JSON messages, pretty much as you’d to with the Janus API.
Let’s keep it simple for now, and let’s just use the admin.html page to check what the admin API can provide us with when we launch the echo test demo. We’ll be presented with one or more session identifiers: this is because the admin API lists all the Janus sessions that are active on Janus. Let’s assume, for the sake of simplicity, that ours was the only session there. At this point, we’re interested in one of the session’s handles, as we want to know what is happening WebRTC-wise (since, as you know, a handle in Janus has a 1-1 relationship with a PeerConnection). Again, let’s assume there’s just a single handle in the session we selected, which is reasonable within the context of the echo test demo. The result is what can be seen in the following picture:
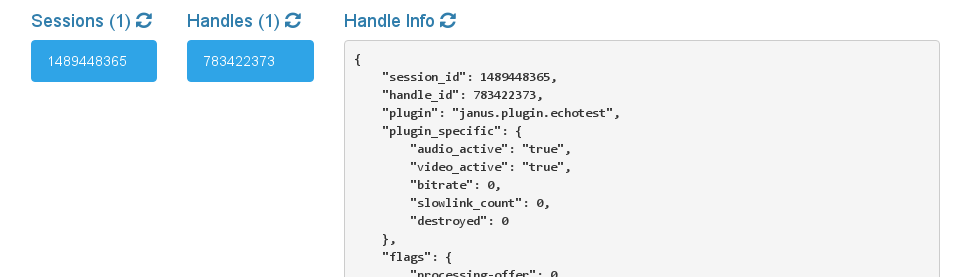
The Janus admin API has returned a whole bunch of information on the selected handle, which can be basically divided in 5 parts:
- generic header information (IDs);
- plugin-specific information (provided by plugins themselves);
- handle read-only flags (their current state in Janus);
- local and remote SDPs;
- PeerConnection information.
{
	// 1. Header
    "session_id": 1489448365,
    "handle_id": 783422373,
    "plugin": "janus.plugin.echotest",
	// 2. Plugin specific
    "plugin_specific": {
	[..]
    },
	// 3. Handle flags
    "flags": {
	[..]
    },
	// 4. SDPs
    "sdps": {
	[..]
    },
	// 5. PeerConnection
    "streams": [
	[..]
    ]
}
All of these parts provide useful data, for one reason or another. Anyway as you can guess, the most interesting piece of information is the last one, as it can provide precious details when it comes to understanding what may be going wrong on the WebRTC aspect. Specifically, the PeerConnection section is organized as an array of “streams”, where each “stream” represents a connection: considering all WebRTC browsers make use of BUNDLE, most of the times you’ll see a single “stream” wrapping both audio and video. Each stream is in turn divided in 3 parts:
- header;
- SSRC info;
- ICE components.
The ICE components represent the heart of the info, here, as they provide you with details about the local and remote candidates Janus is aware of, ICE state (e.g., whether establishing a connectivity with the peer succeeded or not), DTLS state (whether or not the DTLS handshake was completed) and the amount of data that has been exchanged, during the whole session or in the last second. Again, since all WebRTC browsers also support rtcp-mux besides BUNDLE, most of the times you’ll see a single “component” wrapping both RTP and RTCP.
Let’s have a look at what a stream might look like for the echo test demo:
"streams": [
	{
		"id": 1,
		"ready": -1,
		"disabled": "false",
		"ssrc": {
			"audio": 2661735833,
			"video": 393474583,
			"audio-peer": 1799688626,
			"video-peer": 3490310076
		},
		"components": [
			{
				"id": 1,
				"state": "ready",
				"local-candidates": [
					"1 1 udp 2013266431 172.17.0.3 46974 typ host\r\n",
					"2 1 udp 2013266431 143.225.229.138 33172 typ host\r\n",
					"3 1 udp 2013266431 2002:8fe1:1cc3:b:5c48:51ff:fee9:11ef 37350 typ host\r\n",
					"4 1 udp 2013266431 fec0::b:5c48:51ff:fee9:11ef 55243 typ host\r\n"
				],
				"remote-candidates": [
					"1434301788 1 udp 2122260223 192.168.0.10 49044 typ host generation 0",
					"2741881992 1 udp 1686052607 95.247.194.217 49044 typ srflx raddr 192.168.0.10 rport 49044 generation 0"
				],
				"selected-pair": "2  2741881992",
				"dtls": {
					"fingerprint": "D2:B9:31:8F:DF:24:D8:0E:ED:D2:EF:25:9E:AF:6F:B8:34:AE:53:9C:E6:F3:8F:F2:64:15:FA:E8:7F:53:2D:38",
					"remote-fingerprint": "FF:12:C8:72:DA:61:86:E5:01:BD:C0:3C:BE:06:A9:E7:99:44:7B:A7:D2:B8:80:CA:D3:D8:FE:F2:5D:88:D1:21",
					"dtls-role": "active",
					"dtls-state": "connected",
					"valid": 1,
					"ready": 1,
					"sctp-association": 1
				},
				"in_stats": {
					"audio_bytes": 114194,
					"video_bytes": 1629684,
					"data_bytes": 2159,
					"audio_nacks": 0,
					"video_nacks": 0,
					"audio_bytes_lastsec": 4459,
					"video_bytes_lastsec": 74228
				},
				"out_stats": {
					"audio_bytes": 126734,
					"video_bytes": 1645964,
					"data_bytes": 2498,
					"audio_nacks": 0,
					"video_nacks": 0
				}
			}
		]
	}
]
As you can see, everything is working as expected, here: the ICE state is “ready” and we see a working pair has been selected; the DTLS state is “connected”, meaning everything is fine there too; finally, Janus is both sending to and receiving packets from its peer, as evidenced by the “out_stats” and “in_stats” respectively.
As such, when something’s not working as expected, this is the best place to look at, especially if ICE or DTLS have not been completed for any reason, or you see empty sections where details should be available. It’s worthwhile to point out that you should not necessarily assume something’s wrong if the “in_stats” increase while the “out_stats” are empty or null, or viceversa. In fact, in Janus not all PeerConnections are bidirectional as in the case of the Echo Test plugin: in the case of the VideoRoom plugin, for instance, you’ll get monodirectional PeerConnections according to their purpose, and so you’d only have “out_stats” for subscribers (who only receive media from Janus, and don’t send any) and only “in_stats” for publishers (who only send media to Janus). The same might apply to other plugins as well.
Let’s see an example of a “broken” PeerConnection instead:
"components": [
    {
        "id": 0,
        "state": "disconnected",
        "local-candidates": [
            "1 1 udp 2013266431 172.17.0.3 46008 typ host\r\n",
            "2 1 udp 2013266431 143.225.229.138 60710 typ host\r\n",
            "3 1 udp 2013266431 2002:8fe1:1cc3:b:5c48:51ff:fee9:11ef 58925 typ host\r\n",
            "4 1 udp 2013266431 fec0::b:5c48:51ff:fee9:11ef 52486 typ host\r\n"
        ],
        "dtls": {},
        "in_stats": {},
        "out_stats": {}
    }
]
In this example, ICE is “disconnected”, which means the ICE connectivity checks never started at all. As a result, the DTLS and data stats sections are obviously empty, as Janus never got to the point of involving them. What is the cause of the problem here? Looking at the data Janus provides, one thing immediately pops to the eye: there are just local candidates (the ones Janus gathered for itself), but no remote candidates at all: this means that the client failed to send them to Janus for some reason (e.g., your client is not sending trickle candidates) and so Janus can’t do anything to establish a media connection.
Let’s look at this other example, still involving, for the sake of simplicity, the Echo Test demo.
"components": [
	{
		"id": 1,
		"state": "failed",
		"local-candidates": [
			"1 1 udp 2013266431 172.17.0.3 42083 typ host\r\n",
			"2 1 udp 2013266431 143.225.229.138 41619 typ host\r\n",
			"3 1 udp 2013266431 2002:8fe1:1cc3:b:5c48:51ff:fee9:11ef 46602 typ host\r\n",
			"4 1 udp 2013266431 fec0::b:5c48:51ff:fee9:11ef 33518 typ host\r\n"
		],
		"remote-candidates": [
			"1434301788 1 udp 2122260223 192.168.0.10 56611 typ host generation 0"
		],
		"dtls": {},
		"in_stats": {},
		"out_stats": {}
	}
]
This scenario is similar to the previous one, but with a couple of notable differences. First of all, this time we have remote candidates. Besides, the ICE state is not “disconnected” but “failed”, which means the ICE connectivity checks started and eventually, after some time, failed: as such, no connectivity could be established, and so no DTLS handshake could be started and media exchanged at all. When this happens, this can be usually ascribed to a couple of reasons:
- missing information, that is, not enough data for ICE to succeed;
- a network problem, e.g., firewalls or restrictive components fighting ICE somehow.
In this case we can see how the only remote candidate is a private address. Private addresses are obviously unreachable from the outside, which might indicate that this is the reason why Janus couldn’t contact the peer. Anyway, when the other peer has a public address (as is the case of Janus, here), ICE also has means to succeed even in those cases, by leveraging the so called peer-reflexive addresses. The fact that the client only provided a private address could be caused by two different reasons:
- the client was not configured with a STUN server to use (which, if you’re using our
janus.jslibrary should never happen); - the client tried to contact the STUN server but failed to get a response.
In case the cause is the latter, this probably means that there are either network issues or network filters in place. To avoid scenarios like this, it’s always best to also configure clients with a TURN server, so that they can try to take advantage of that to overcome potential limitations on theit network traffic. This also suggests that, if the peer with only private addresses is Janus (e.g., because you deployed Janus on a cloud provider that has a private address), you also need to specify a STUN server for Janus itself. It is usually not needed, instead, to specify TURN servers for Janus to use: TURN servers are typically only needed by clients.
Finally, let’s check this last scenario. In this example, we’re trying to watch a Streaming plugin mountpoint, but nothing comes through, just a black screen. Let’s assume this is the information the admin API provides for the handle’s component:
"components": [
	{
		"id": 1,
		"state": "connected",
		"local-candidates": [
			"1 1 udp 2013266431 172.17.0.3 50886 typ host\r\n",
			"2 1 udp 2013266431 143.225.229.138 58254 typ host\r\n",
			"3 1 udp 2013266431 2002:8fe1:1cc3:b:5c48:51ff:fee9:11ef 49885 typ host\r\n",
			"4 1 udp 2013266431 fec0::b:5c48:51ff:fee9:11ef 50676 typ host\r\n"
		],
		"remote-candidates": [
			"1434301788 1 udp 2122260223 192.168.0.10 49782 typ host generation 0",
			"2741881992 1 udp 1686052607 95.247.194.217 49782 typ srflx raddr 192.168.0.10 rport 49782 generation 0"
		],
		"selected-pair": "2  2741881992",
		"dtls": {
			"fingerprint": "D2:B9:31:8F:DF:24:D8:0E:ED:D2:EF:25:9E:AF:6F:B8:34:AE:53:9C:E6:F3:8F:F2:64:15:FA:E8:7F:53:2D:38",
			"remote-fingerprint": "FF:12:C8:72:DA:61:86:E5:01:BD:C0:3C:BE:06:A9:E7:99:44:7B:A7:D2:B8:80:CA:D3:D8:FE:F2:5D:88:D1:21",
			"dtls-role": "passive",
			"dtls-state": "connected",
			"valid": 1,
			"ready": 1
		},
		"in_stats": {
			"audio_bytes": 0,
			"video_bytes": 0,
			"data_bytes": 900,
			"audio_nacks": 0,
			"video_nacks": 0,
			"audio_bytes_lastsec": 0,
			"video_bytes_lastsec": 0
		},
		"out_stats": {
			"audio_bytes": 0,
			"video_bytes": 0,
			"data_bytes": 1227,
			"audio_nacks": 0,
			"video_nacks": 0
		}
	}
]
As you can see, ICE was successful and DTLS is connected too, so it’s definitely not a network or crypto issue. So what’s the problem? In this case, since it’s the Streaming plugin, we need to check if Janus is indeed sending anything to the user at all: in fact, we’re not interested in verifying whether Janus is receiving anything, since Streaming plugin users will always only receive and not send. As such, ignoring the zero-ed “in_stats” section and looking at the “out_stats” info instead, the only value we see that is larger than zero is “data_bytes”, which is to be expected since that value includes the DTLS handshake traffic; audio and video, instead, are both zero. This means that Janus is NOT sending anything to the user, which explains the black screen. Since Janus only sends what plugins tell it to send, this means it’s the Streaming plugin that is not sending anything: one common cause for this is when you try to watch a mountpoint you’re not feeding with data, e.g., you’ve not launched any FFmpeg, GStreamer or other tool to provide the plugin with media to relay. If this had been related to the VideoRoom plugin, a subscriber receiving no data might mean the issue is on the publisher side, e.g., a publisher that is either not sending media for any reason or one that had not been correctly setup.
These are just a few simple examples of typical scenarios that might occur. They should, nevertheless, provide yoou with enough insight on what to look for when things don’t work for you for some reason.
To conclude, all the examples that we just saw by inspecting the admin.html webpage are, as anticipated, also replicable by contacting the Janus admin API directly, which is what the demo webpage does in JavaScript after all. If you’re interested in more details about how to send these messages, check the related Janus admin API docs page.